| Product Description |
Recombinant CHO-K1 cells stably overexpress human G protein-coupled bile acid receptor 1 (GPBAR1) on the surface and contain high levels of G protein Gαs to couple with the receptor in downstream signaling pathways. |
| Culture Properties |
Adherent. |
| Stability |
Stable through more than 16 passages with no significant changes in assay performance or expression profile. |
| Size |
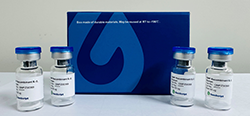
Two vials of frozen cells (>1×10⁶ per vial in 1 mL). |
| Storage |
Store cells in liquid nitrogen immediately upon receipt. Thaw and recover cells within one year from the date received. |
| Culture Medium |
Ham’s F-12K (Kaighn’s), 10% FBS, 200 μg/ml Zeocin (Cat. No. R250-01, Life Technologies) |
| Complete Growth Medium |
Ham’s F-12K (Kaighn’s), 10% FBS |
| Freeze Medium-DATA |
45% Ham’s F-12K (Kaighn’s) (Cat. No. 21127, Life Technologies), 45% FBS (Cat. No. 10099-141, Life Technologies), 10% DMSO (Cat. No. D2650, Sigma) |

Figure 1. Dose dependent stimulation of intracellular cAMP accumulation upon treatment with lithocholic acid (LCA) in CHO-K1/GPBAR1 cells. d2 acceptor fluorophore-labeled cAMP (Cat. No. 62AM4PEB; Revvity) and intracellular cAMP in CHO-K1/GPBAR1 cells competitively bind with Europium Cryptate-labeled anti-cAMP antibody. The FRET signal decreases as the intracellular cAMP concentration rises and was measured by plate reader (Pherastar, BMG). The EC50 of LCA on CHO-K1/GPBAR1 cells was 3.34 μM.
For research use only. Not intended for human or animal clinical trials, therapeutic or diagnostic use.
如您需要获取细胞系产品的说明书,请点击“Manual”,完善信息后点击“提交”。
黄金城集团会第一时间联系回复您。注意:中国地区购买的产品,说明书需要以中文站为准。
您也可拨打400-0258686转5810,或发邮件至product@nrapc.com联系黄金城集团。
更多产品文件类型 >>


